Housing Market Snapshot [INFOGRAPHIC]
Some Highlights

Some Highlights:
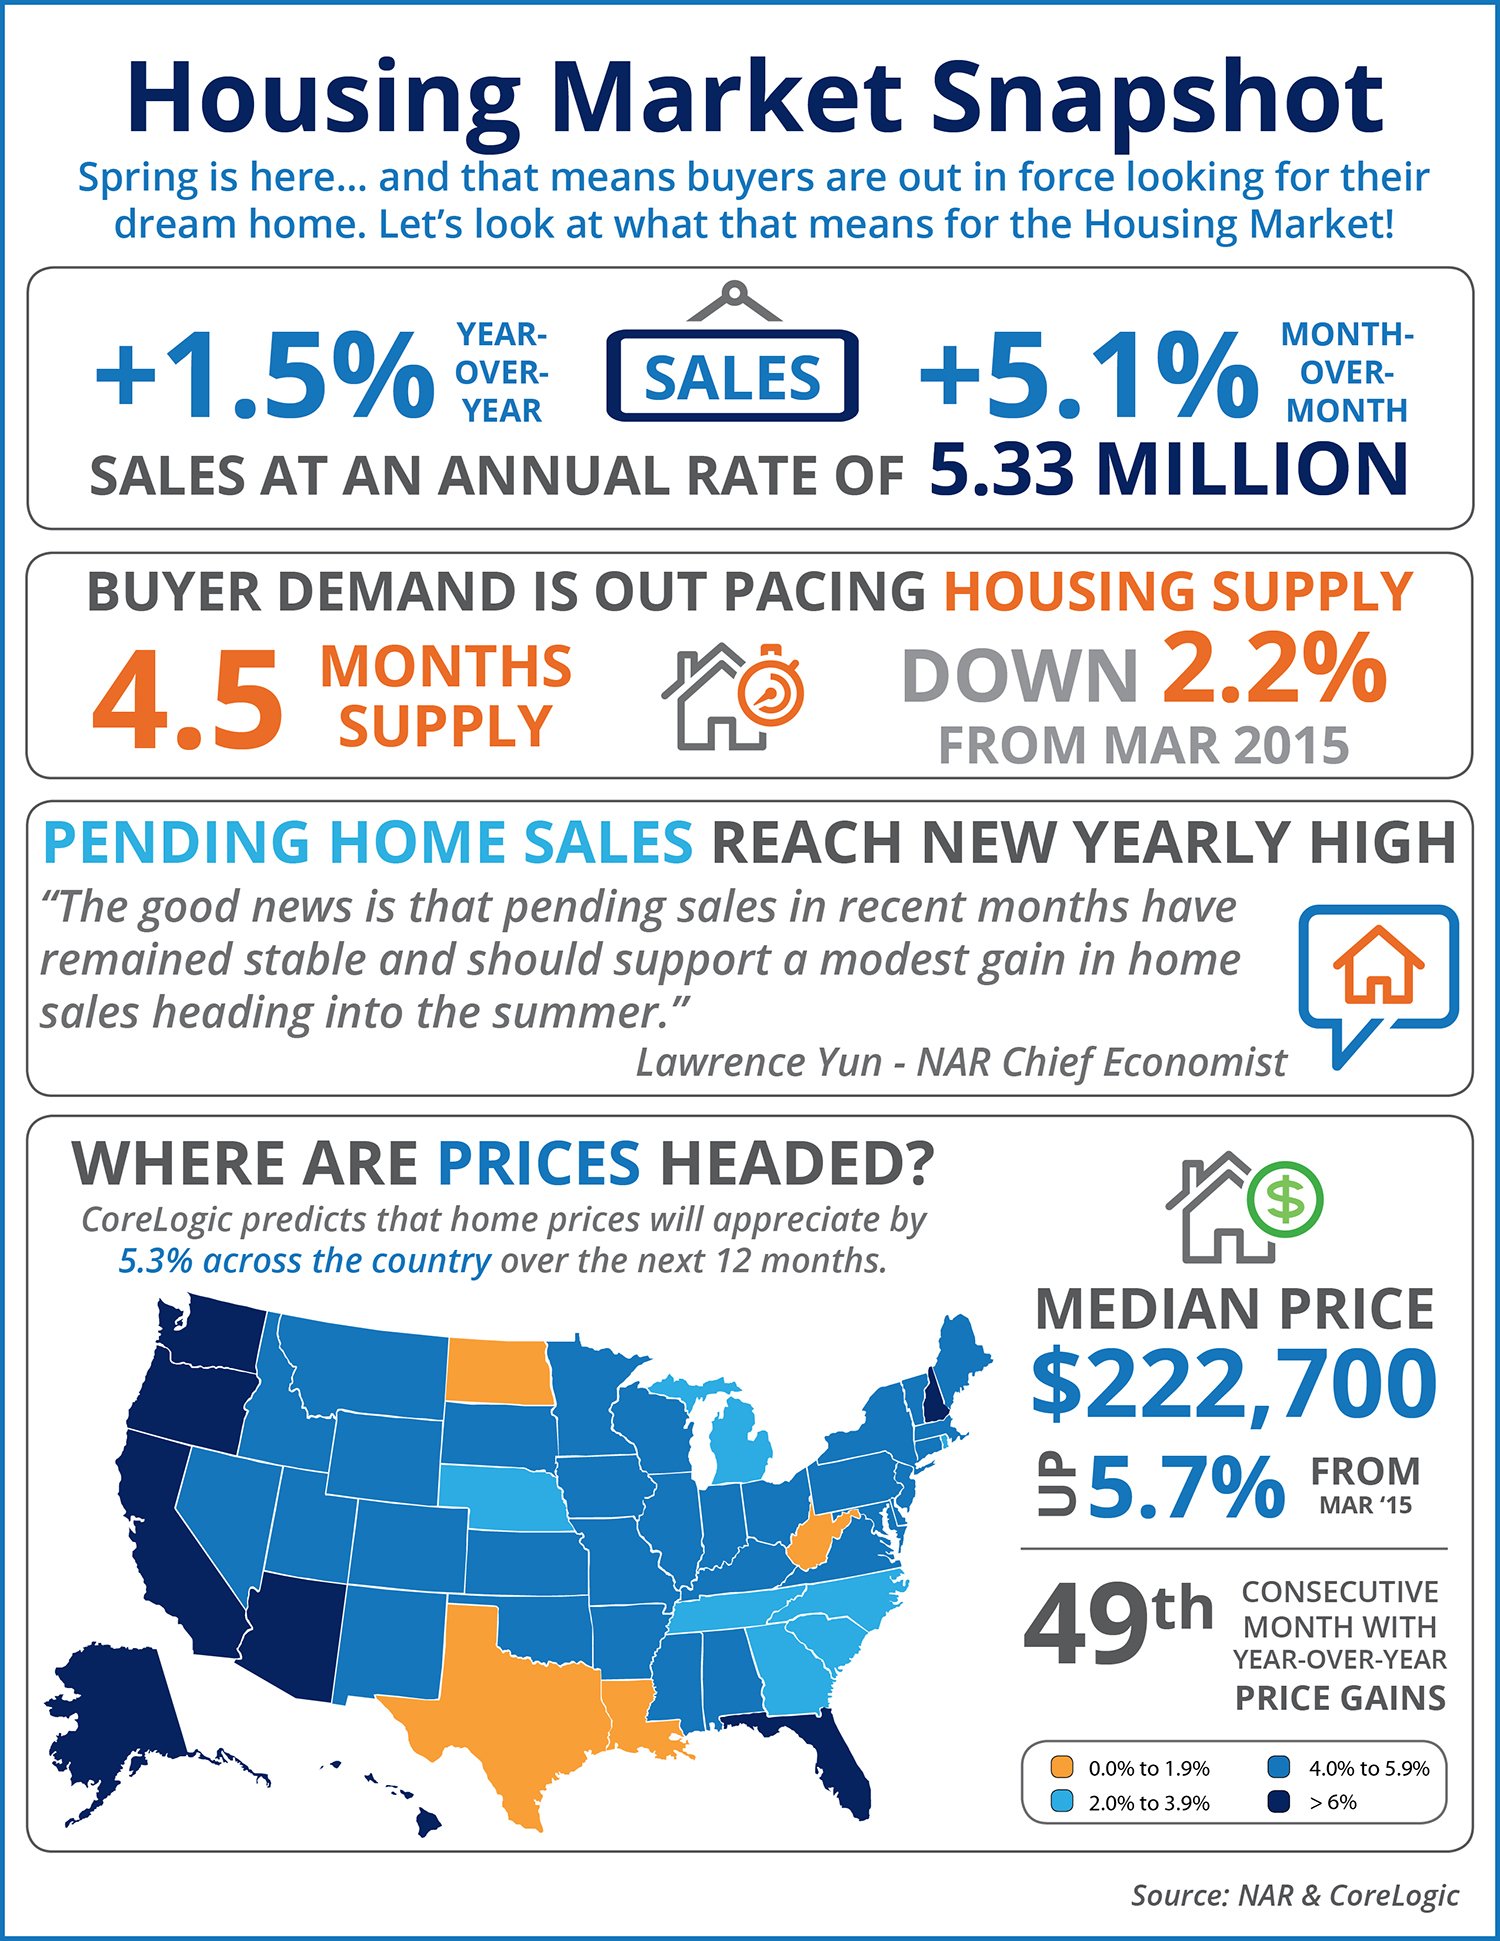
- Home sales are up 1.5% year-over-year and 5.1% month-over-month.
- Demand is still much higher than the available housing inventory which declined 2.2% from March 2015.
- This is the 49th consecutive month with year-over-year price gains.