Real Estate withThor Odinson
HomeVideos
  • Buyers Guide
  • Sellers Guide
CalculatorsSearchEspañol

InfographicsFriday, December 12, 2014

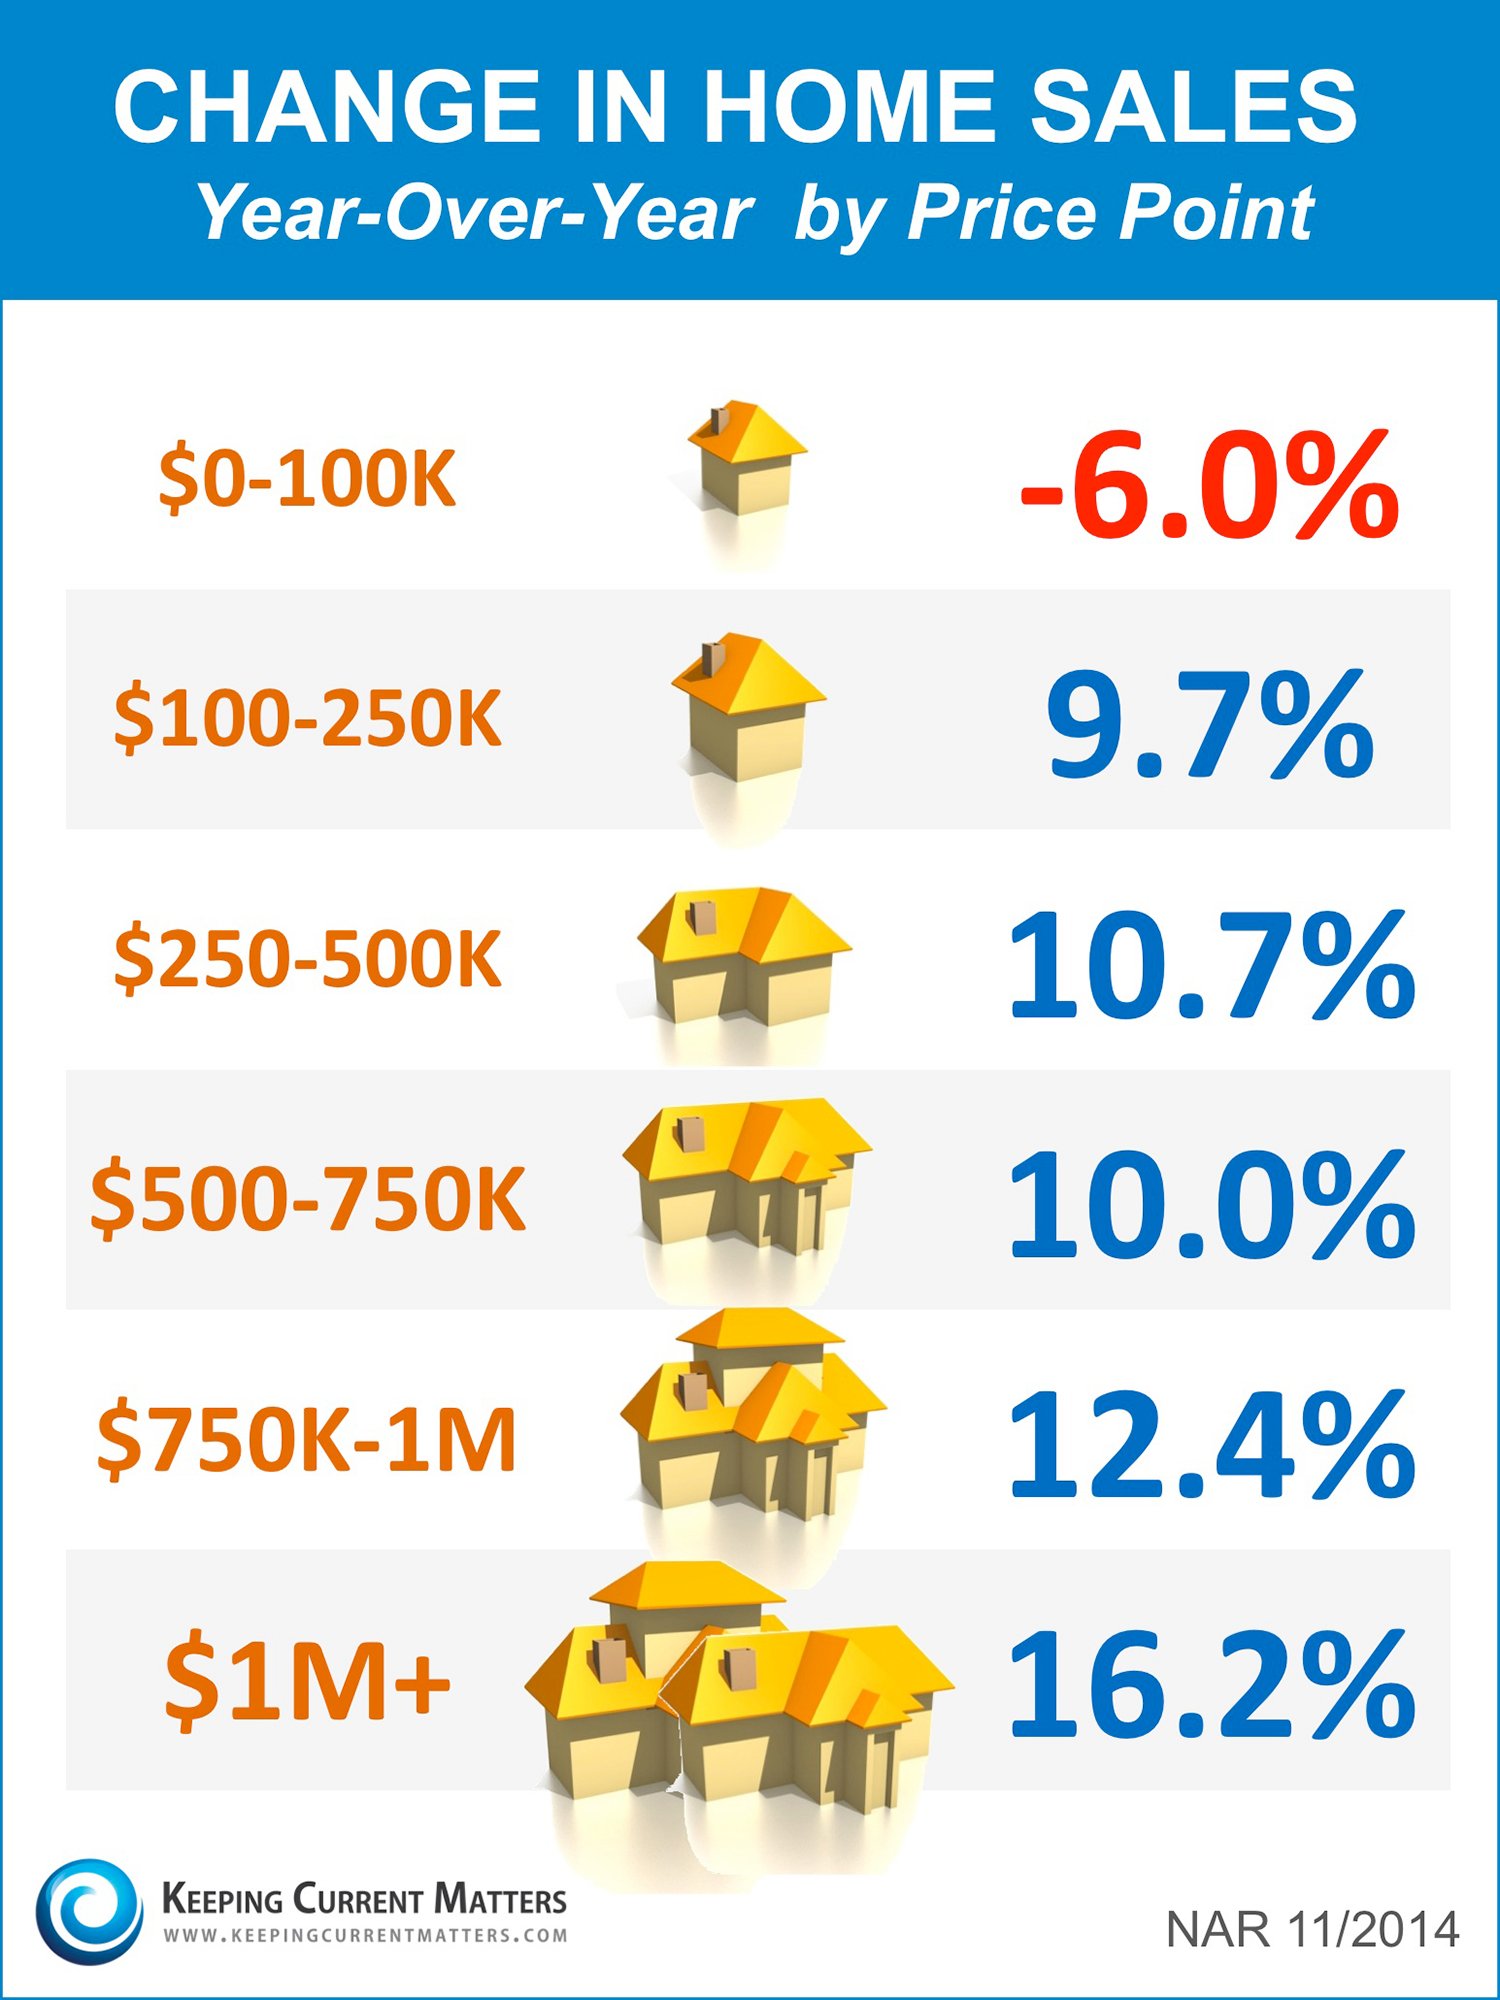
Year-over-Year Change in Home Sales by Price Point [INFOGRAPHIC]

Year-over-Year Price Changes by Price Point [INFOGRAPHIC] | Simplifying The Market

Some Highlights

Year-over-Year Price Changes by Price Point [INFOGRAPHIC] | Simplifying The Market

Share this

FacebookXLinkedInPinterestEmail

← PreviousConfusing Real Estate News? An Agent Can HelpNext →New York Times: Homeownership is Best Way To Build Wealth
Thor Odinson

Thor Odinson

Engineering Manager

Test2

KCM

Test bio update from Labs

  • All Categories
  • Uncategorized
  • For Buyers
  • For Sellers
  • Foreclosures
  • Infographics
  • Home Prices
  • First-Time Buyers
  • Senior Market
  • Mortgage Rates
  • Move-Up
  • For Sale by Owner
  • Featured
  • New Construction
  • Luxury / Vacation
  • Rent vs. Buy
  • Time-sensitive
  • Outdated
  • Internal
  • Do Not Autopost
  • Inventory
  • Agent Value
  • Affordability
  • Buying Tips
  • Downsize
  • Economy
  • Equity
  • Forecasts
  • Selling Tips
  • Expired/Withdrawn/Canceled
  • Price It Right/Overpricing

The information contained, and the opinions expressed, in this article are not intended to be construed as investment advice. Thor Odinson and Keeping Current Matters, Inc. do not guarantee or warrant the accuracy or completeness of the information or opinions contained herein. Nothing herein should be construed as investment advice. You should always conduct your own research and due diligence and obtain professional advice before making any investment decision. Thor Odinson and Keeping Current Matters, Inc. will not be liable for any loss or damage caused by your reliance on the information or opinions contained herein.

Equal Housing Opportunity

© 2026 Thor Odinson

HomeSearchPrivacy Policy